Using ARR (Automated Review Request) is crucial if want to get more and more customer reviews, but much more important is to understand which campaign worked better. When is the conversion better, at the first email request or the second one? Below we will explain to you how to use, read and understand Wiremo ARR statistics.
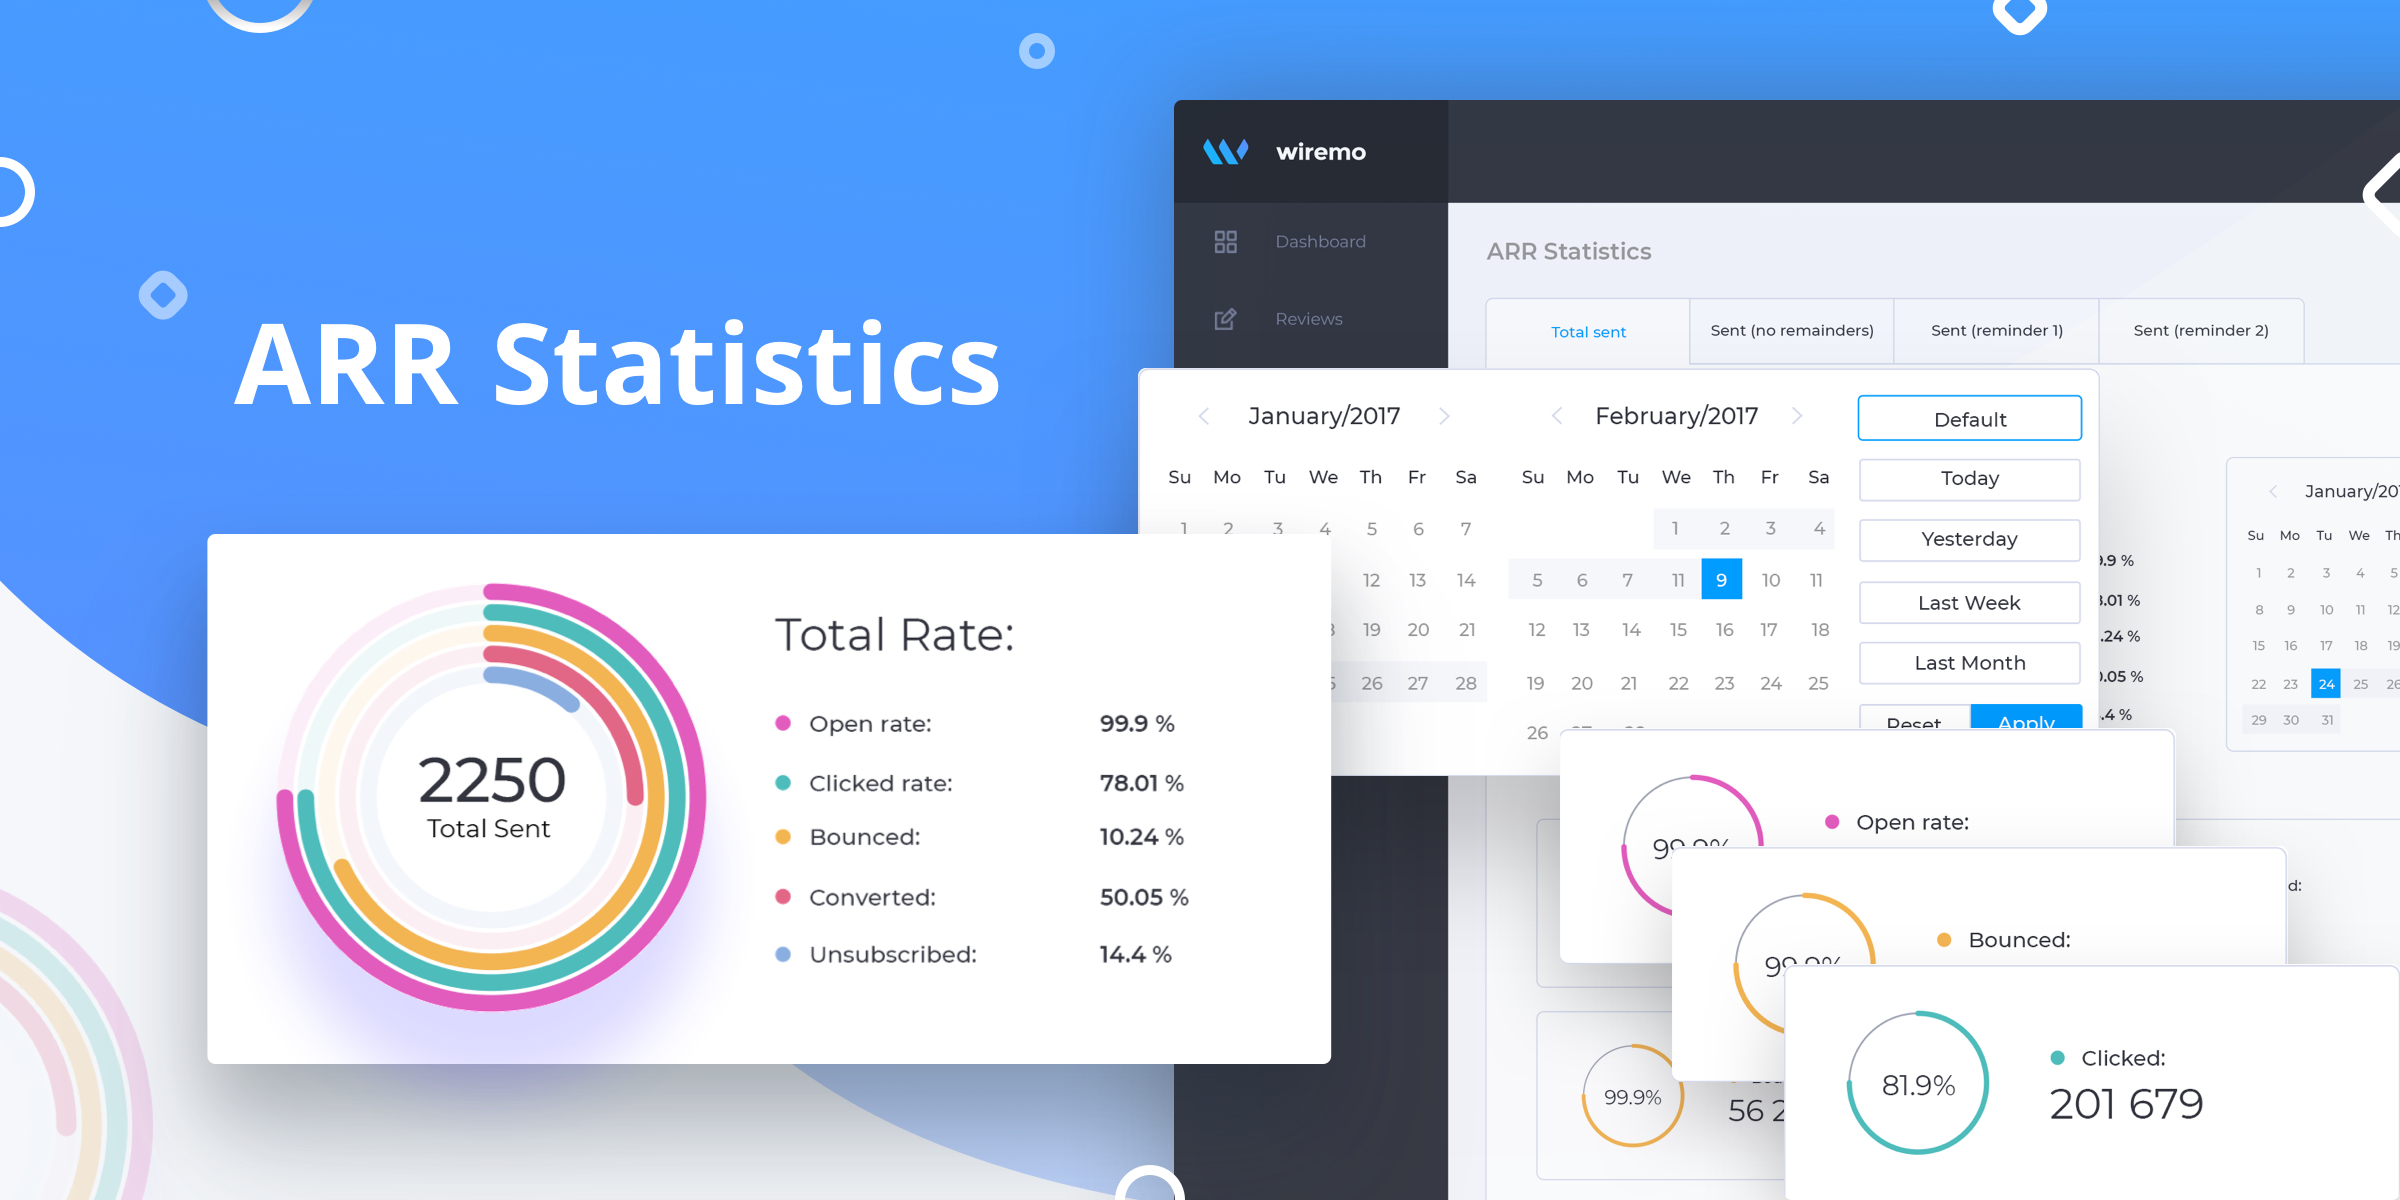
ARR statistics - as easy as pie
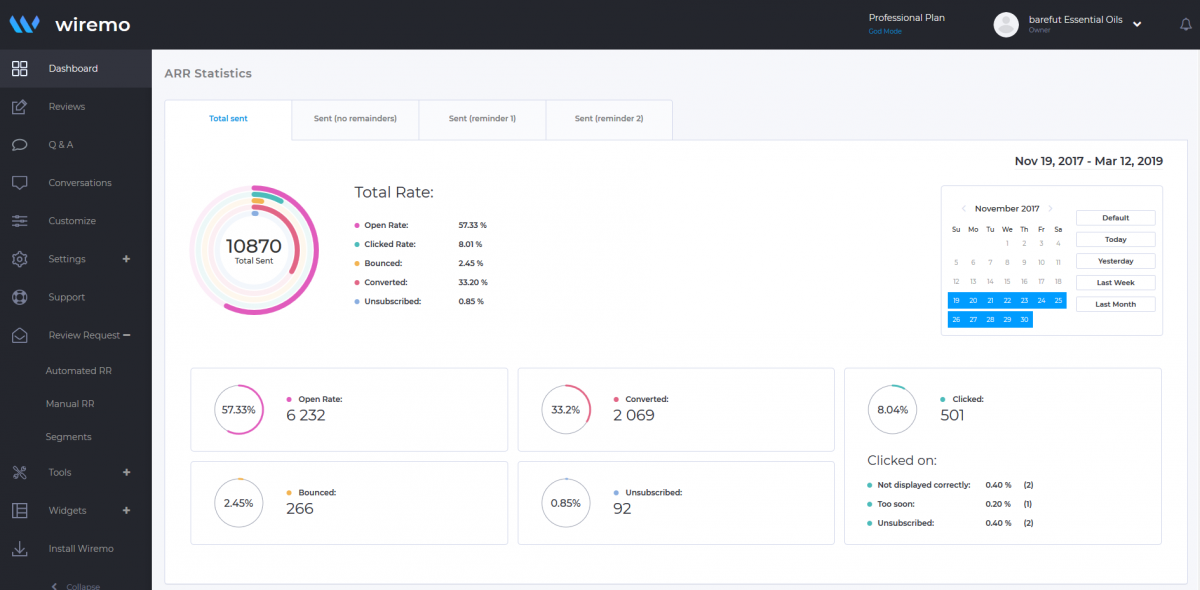
The image above is a screenshot from a real and running ARR campaign, provided by one of our customers - Barefut. Below we will describe every chart in it.
As you can see, there are some tabs. Every tab shows you the statistics using the same type of charts, but with different data.
- Total sent - General stats about the current campaign. It includes all the emails that were sent including all reminders.
- Sent (no reminders) - refers only to the first review request emails.
- Sent (reminder 1) - refers only to the first reminder (if it was configured).
- Sent (reminder 2) - refers only to the second reminder (if it was configured).
- The charts in the tabs have the same design; the only difference are statistics.
We already mentioned that all the tabs are using the same type of charts. That's why we will explain to you what the charts show using the first tab. It is the main and general report.
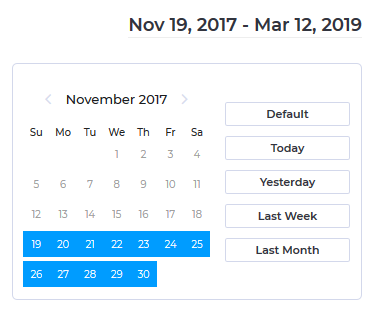
Choose the period
It is essential to have the possibility to understand how the campaign worked in different periods. Here you can select the period you want. By default, it will show you statistics from all the time, but you can select to see it for "Today", "Yesterday", "Last Week", "Last Month" or select a custom one using the calendar. If you want to get back and see stats for all period press on the "Default" button.
Total Rate Chart
The main chart shows the total rate in a visual way and percents. This way you can get the first impression if the campaign works well or there is something wrong. Here you can see:
- Open rate - Email open rate is the percentage of the total number of people who opened an email from the current ARR.
- Clicked rate - is the percentage of people who click on one of the elements from the email like the links "Not displayed correctly", "Too soon", "Unsubscribe" or your logo, product image or stars for the on-landing template. It is also important to understand that this rate is related to the opened emails.
- Bounced - is the percentage of email addresses in your email list that didn't receive your review request because it was returned by a recipient mail server.
- Converted - is the percentage of your customers who wrote a review.
- Unsubscribed - the percentage of people who opt out from the current ARR, these customers won't get any review request emails anymore.
In the center of the main chart, you can see the total number of emails that were sent (it includes reminders and resent emails).

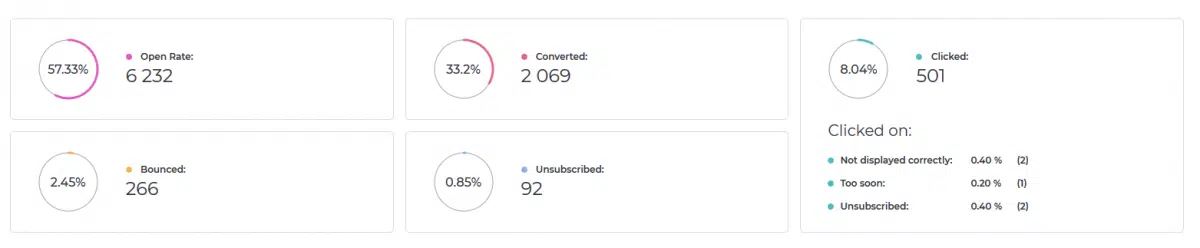
Detailed stats - The devil is in the detail
From the total rate chart, you can find general info in percentage, but it also essential to know the exact number of every of this percent. Below the total rate chart and the calendar you can find detailed statistics about the exact number of email that was opened, bounced, converted, unsubscriber and clicked. Also, we've designed a unique chart for the clicked email rate. You can find the exact number of emails for the links in email - "Not displayed correctly", "Too soon" or "Unsubscribe".
Important:Due to the fact that all the click stats was merged before 03/01/2019, the stats for Sent reminders 1 and 2 are unavailable for the ARR campaigns created before 03/01/2019. Starting this date all the email clicks will be noted separately and shown in the new statistics design.
If you have any question regarding ARR stats, don't hesitate to contact our support team. Thank you for choosing Wiremo.