Google Analytics is an important tool, especially for beginners, when it comes to tracking their data. Furthermore, it’s a free tool that every website owner should take advantage of, thanks to its valuable set of features.
Google Analytics for beginners portrays the direction your website is taking by providing essential data about your visitors.
Most importantly, Google Analytics accounts for page views, sessions, and devices, among other metrics. Therefore, if you want to improve on your website offerings, you need to consider these insights as they show the best, where changes would be necessary.
But you might be wondering what Google Analytics is, how to set up Google Analytics and how to use it as a beginner.
Apart from enrolling in the Google Analytics academy for free Google Analytics training, you can get the basics from this article. Read on to learn everything about Google Analytics and how you can leverage it to grow your business.
Make it easier for your customers to leave feedback, generate a QR Code for Google Review and start collecting positive reviews with just a quick scan
What Is Google Analytics?
Every website owner should rethink their strategy if they’re yet to install this handy tool on their websites. Google Analytics is a must-have tool for tracking your site’s traffic and everything regarding your website performance.
It’s an important tool that comes in handy when you want to know what you should improve, as it gives all the valuable insights you need to know about your audience.

Note that Google Analytics is a free resource available to help you make informed decisions on your website performance.
On your website, Google Analytics provides important data on who your visitors are, where they come from, the pages they visit most, how long they stay on your website, and when they leave your website.
Gaining such insights about your audience is necessary for deciding where to improve or change your strategy.

On the other hand, installing Google Analytics on your blog analyzes the most popular pages and the number of blog visitors you convert. As a result, you can adopt the best keywords that you’re ranking for.
How To Set Up Google Analytics
Before you start using Google Analytics to gather stats on your website, you need to set it up. If you have a Google account, you can proceed to the next step. If not, you have to start by creating one.
Here’s a step-by-step guide on how to set up Google Analytics:
- Sign up for a Google Analytics account by going to the Google Analytics homepage;
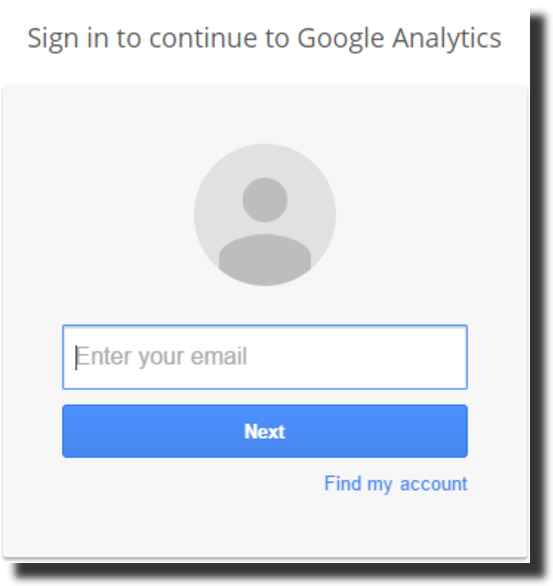
- Choose the Google account you want to launch your Google Analytics. However, you'll have to sign up the account to Google Analytics if it’s not yet signed in.
Just sign up then click next. When you do so, you’ll receive a message titled welcome to the Google Analytics page. Click continue and proceed to the next page.
If you already have an existing Google Analytics account, you can proceed by signing in to the account. Click Admin on the bottom left of the page. On the account page, proceed to “+create account”.
- The other step is to tell Google Analytics what you’re tracking. Therefore, you must fill the fields listed below;
- Account name: The account name is the category under which your website falls. Using your brand name is recommended as the account name, so that it’s easier to categorize your brands if you have multiple websites;
Property name: Insert the website URL or the web address of the website you intend to track.
Reporting time zone: Choose your country’s time zone.
Currency: Select your preferred currency.
Show advanced options: Turning on this option creates a Universal Analytics property.
You can achieve this by following these steps:
- Click on Create a Universal Analytics Property;
- Insert the website URL for the website you want to track;
- Choose either Create both a Google Analytics 4 and a Universal Analytics Property or Create a Universal Analytics property only, then click next;
- Business information: Additional business information helps you specify what exactly you want Google Analytics to track on your website.
The other way would be:
- The other step is to add the GA tracking ID. This option is found on the bottom left of the page and you need to click the Admin button to access it. If you set up both a Google Analytics 4 and a Universal Analytics property, select the Universal Analytics (UA) property from the drop-down menu;
- Then proceed to choose Tracking info> Tracking code and here is where the tracking code appears;
- What you need to do now is to copy and paste the Tracking ID on the Google Analytics code section. If you have a website.com type of website, you can access the GA code section by clicking the Site> Site settings> SEO & Analytics. After pasting your tracking code, you must save it at the bottom of the page;
- In case you miss your Tracking ID, you can easily trace it on your Google Analytics. You do this by proceeding to Admin then selecting Universal Analytics property and choosing Tracking Info then finally choosing Tracking Code;
The following actions should be:
- Before going further with your GA setup, you need to agree to terms and conditions. Ticking the box that appears means that you’ve read and understand Google Analytics terms and conditions and are ready to abide by them;
- The other step is finding out if the tracking code appears on all pages of your website. To gain invaluable insights on your website performance, you need to ensure that the tracking code appears on all pages;
- One useful tool you can use for this is the GA checker, which is a tool that scans all your web pages to establish whether the Google Analytics tracking code appears there. You simply do this by inserting your website name then select "check your site". If the code appears on all pages, you'll see the checkmark beside the Google Analytics section;
- The final step is to understand how to use Google Analytics. Once you’ve successfully installed Google Analytics tracking code on all your web pages, you need to know how to collect the data.
Keep in mind that it takes a minimum of 24 hours to see the results of GA but the insights will always be one day behind. So, don't expect to find present-day insights on your Google Analytics of your website.
How To Set Up A Customized Google Analytics Dashboard
If you want a personal touch on your Google Analytics dashboard, you have to consider customizing it to your liking.
Sometimes you want personalized reports which the default Google Analytics dashboard may not give. In that case, a customized analytics dashboard comes in handy. But how do you create it?
Here are the steps to do so:
- The first step is logging in to your Google Analytics page;
- You should then proceed to Customization> Dashboards and press the red “Create” button;
- A popup then appears suggesting two choices (Black Canvas and Starter Dashboard). The latter is a dashboard with no widgets on it, while the latter is a template with default starter widgets;
- After selecting your dashboard, you can proceed by giving a name to your dashboard, then click “Create Dashboard”;
- If you wish to have a more customized template, the Black Canvas is your best bet. The popup allows for widget addition such that you can choose the one that suits you best;
- Also, you can have more than one type of widget including metric, geo map, timeline, or table.
Benefits of Using Google Analytics
First, Google Analytics is a free tool that’s very useful when measuring your site's traffic and all the information you need about your visitors. It also makes it easier to gauge how your site is performing, and portrays the areas you need to improve on.
Google Analytics enables you to optimize your site in a way that your audience loves. This is because it helps you identify the behavior of your website’s visitors.
This important tool pinpoints the changes you need to implement on your site to realize conversions and engagements on your site.
Google Analytics is a free resource that drives results to marketing campaigns, hence motivates you to improve your site.
Different Types Of Reports In Google Analytics
Google Analytics offers you different reports which are valuable when assessing where to improve.
You need to choose the right options depending on what you want to achieve. Before we delve into the reports, here are some basic features of Google Analytics for beginners:
- Left sidebar: This is the section where all the data sets and reports to run are situated.
- Date range: This feature is applicable when you want to set the date range of the data, especially when you want to establish whether the changes you implemented bore fruits.
- Email: The email feature lets you email the report you get to anyone you intend.
- Export: This is the feature in which you take the reports you’re looking at.
- Segments: The segments feature compares different sets of data on your reports. Usually, the default for this feature is “All Users” and you have the liberty to choose up to four segments to compare the data sets.
Here are the different Google Analytics reports:
-
Keyword Analysis Report
The Keyword Analysis report indicates the keywords you’re ranking for besides visitors' metrics, page views, conversions, goal completions, and average page load time.
Measuring keywords performance is important, especially to content marketers, as it helps them optimize them according to their popularity.
Google Analytics also offers a keyword engagement report and revenue tab. This way, it’s easier to establish the keywords that are bringing conversions, hence focus on them.
-
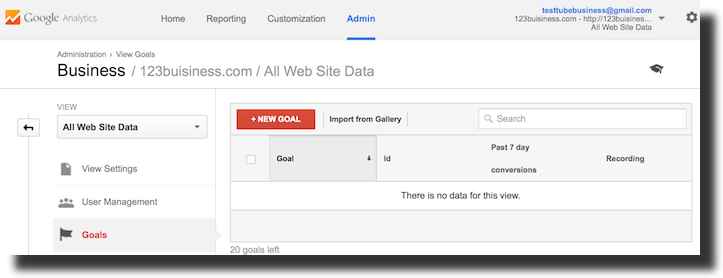
Goal Overview Report
This is a significant report in assessing whether your website performance is in line with the company goals. It’s up to you to set up the metrics you want to track as goals on your website.
For instance, you can choose from submissions or file downloads as the goals you want to track. This way, you’ll receive insights on the total form submissions and file downloads you get on your website.
Furthermore, goal reports indicate the pages that are bringing conversions and the mediums used to reach these pages. This could be search engines, social media channels, or website referrals.
With goal reports, you can compare the current information with the past one so that you gauge whether the performance is positive or negative. This way, you’ll meet company goals more surely.
-
Real-time Reports
Just as the name suggests, real-time reports show your website events as they happen at that very moment. These events are documented in quick succession to keep you on tabs for any updates regarding your audience.
With real-time reports, you can quickly track such metrics as the mobile app, website infrastructure, or website sessions in seconds.
As a result, you’d know where to improve in real-time, especially for your larger sites that bring a million visitors.
Real-time reports are valuable as they break down page views your website gets in minutes and seconds. They also indicate the top keywords you’re ranking for and where your visitors are coming from.
Keep in mind that real-time reports are best for larger sites. If you own a smaller site, you can use the other reports listed to track your website data.
-
Audience Reports
They tell more about your audience’s demographics such as the country of their origin and the overall website traffic.
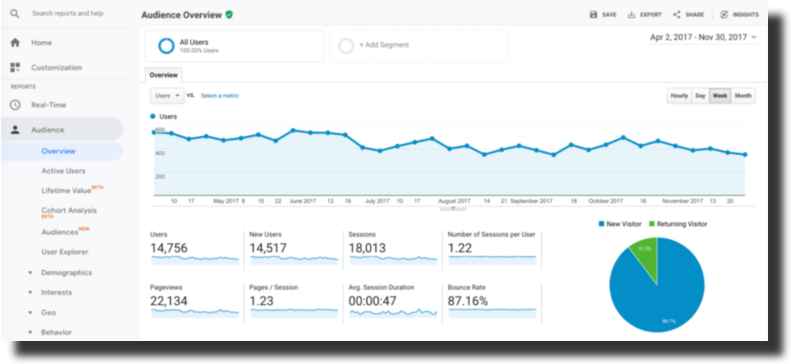
Audience reports also indicate the mediums through which your audience found your audience among other things. You’ll also find active users classified according to the average time they spend on the website.
Generally, audience reports tell this about your audience:
- Their overall number on your website (traffic);
- The type they are, that is new or returning users;
- The devices they use to access your website;
- Their general demographics.
Additionally, there are other reports under the audience section as follows:
- Active users: This report indicates the average time users spend on your website. You can track in terms of 7, 12, 28 days, and so on to gauge if the users’ interest is growing;
- Lifetime value: This report shows the value different users bring to your website based on the different sessions available. You can track users obtained through various channels and evaluate their worth to your business.
If, for instance, a certain e-commerce strategy brings a significant amount of profits, you can confidently concentrate your efforts on it.
- Cohort analysis: Cohort analysis involves the tracking of the performance of users who share common characteristics. Consequently, you can easily analyze their behavior to know where to improve.
-
Acquisition Reports
Visitor acquisition report indicates the medium and the source of your website’s users and whether they are bearing tangible results for your business. It also shows metrics such as total sessions, unique users, new users, goal conversion rate, and goal value per session.
Generally, this report shows that visitors either come from social media, website referrals, or search engines. Therefore, using the analytics visitors acquisition reports helps you to set up useful marketing campaigns as you already know where to target.
Some of the channels Google Analytics uses to track sources:
- Organic search: A free option in which users find your website through a keyword search on search engines;
- Paid search: An option that directs users to your website from paid ads;
- Direct: This is where users find your website without any notable channel;
- Referral: This channel refers to users directed to your website by another website’s link;
- Social: this medium includes users who come to your website from social media networks;
- Other: An option for tracking the sources when it proves unable to categorize a group of traffic.
-
Behavior Reports
Behavior reports show the trends of new and returning users, including their retention time on your website. These insights include overall user traffic, conversions, and average page views on your website.
If you create engaging content for your site, it’s important to check the behavior reports. This helps you to test whether it’s working as expected.
You can also rely on them on your marketing campaigns as they are such important metrics in evaluating your audience behaviors in regards to your campaigns.
If you're in sales, behavior reports make it easy to track the conversions around the marketing goals you've pre-set.
-
Conversions Reports
These reports show the results your marketing efforts are yielding in terms of converting your website visitors into actual customers.
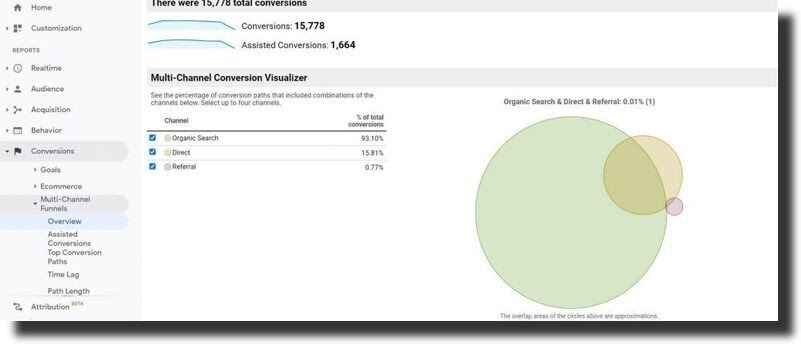
Image courtesy: firstsiteguide.com
You’ll find different ways to track your conversions:
- Goals: This is a report showing your performance in the goals you’ve set and their conversions. Besides, it helps you quantify the ROI and the monetary value of your goals. As a result, you can assess whether your marketing campaigns are meeting the company goals.
- Ecommerce: The Ecommerce reports matter if you have an e-commerce store on your website. Through it, you can gain insights into the checkout processes, product sales, and inventory.
- Multi-Channel Funnels: This report reveals how different mediums such as search engines, social media campaigns, landing pages, and advertisements work towards turning website visitors into customers. The multi-channel report comes in handy when wishing to improve the overall sales of your website.
Here are goal reports in Google Analytics conversions:
- Goals Overview: The Goal Overview reports allow you to track the conversions real quick and plan a cause of actions. Most importantly, you’ll check the Goal Completions, Goal Value, Goal Conversion Rate, and Abandonment Rate. When you’re sure which section is failing, you can conveniently make the necessary changes to your goal strategy.
- Goal URLs: This report segregates conversions into Goal Completion URLs such that you’re able to know exactly where the conversion took place. That’s why it’s overly crucial for you to make every page URL unique. As a result, you’ll easily identify the best-performing product page.
- Funnel Visualization: The Funnel Visualization report shows the step-by-step process your visitors are using to land on specific pages. It shows the actions at each step and at what step the conversions happened. As a result, you’ll know at what step you’re losing or gaining visitors on your page. If it’s in the start step, you can make changes and on the checkout point if it’s where you’re losing it.
- Goal Flow: A Goal Flow report is more flexible than the funnel visualization report as it supports historical data analysis, advanced segmentation, and funnel analysis. Before starting analyzing the goal flow report, you must set at least one goal/ funnel for your products. This way, you can rest assured of improved customer experiences and increased sales funnels.
-
Mobile Performance Report
The mobile performance report reveals the mobile-friendliness of your website, thus worth looking at if you’re thinking about launching a mobile app.
It precisely shows the types, make, and model of the devices your audience is using to navigate your website. This way, you know where to improve your website in terms of mobile optimization.
If your company products cannot be conveniently viewed on mobile devices, you’ll have to devise ways to do it. The mobile overview report checks where you can make changes to improve rankings and visibility on search engines.
Google penalizes pages that are not optimized for mobile devices as they don’t support the AMPs (Accelerated Mobile Pages). Therefore, you should look at the mobile performance report frequently to gauge where you lie.
-
Page Speed Overview Report
Through Google Analytics, you can tell your site’s average load time, and therefore, improve it if needed. Usually, slow pages are a turn-off to users as they need to find what they are looking for in real-time.
In fact, according to a survey by Google, 53% of people leave any website if takes more than three seconds to load. However, the average web loading time should be 22 seconds, so you can gauge your website.
The page speed overview report helps you establish the speed at which each page loads so that you know where to improve. This report also shows the loading time in different countries and browsers. As a result, you can easily note any page with slow load times and work on a plan to improve it.
Some of the page speed reports include:
- Explorer: This report gives page information in terms of various primary and secondary dimensions. It provides such metrics as site usage, technical, and DOM timings;
- Distribution: The distribution report gives the timing for different metrics;
- Map Overlay: The Map Overlay reports indicate the geographical data for primary and secondary dimensions. It includes the metrics such as site usage, technical, and DOM timings.
-
Content Reports
The Content reports give you a detailed analysis of all the landing pages, web pages, and blog posts on your website. These reports are further categorized into:

Image courtesy - Moz
All pages report: This report lists the traffic for each of the pages on your website. It shows the most trafficked pages within a specified time.
Content Drilldown report: This report shows a breakdown of the pages into subdomain and subfolder, and then shows their metrics.
Landing page report: The landing page report gives the knowledge about the product right from the start. Using this report, you’ll understand whether your landing pages are yielding the expected results or not.
Exit page report: This report shows the final page the visitors visited on your website. Usually, this would be the checkout page which tells if there were any conversions.
Pros & Cons of Google Analytics
Pros:
- With Google Analytics you can easily evaluate which marketing campaigns were effective by using Goal reports to do so;
- GA gives detailed information on your visitors, from how they reached your page, their viewing time, and also tracks their activities on your website pages;
- Google Analytics provides detailed traffic data such that it becomes easy to make informed decisions. It’s also easy to use and intuitive thanks to the amazing features.
Cons:
- You might find yourself investing in an extra hand of a webmaster to install the tracking code for you if you lack website development skills;
- Learning how to use Google Analytics is a bit tricky and cumbersome. Furthermore, there are no simplified resources to learn this resourceful tool;
- GA tracks traffic from bots and sometimes cites data from unknown sources as direct. Therefore, you can't always rely on traffic updates given by Google Analytics.
How Google Analytics Can Help You Boost Your Web Traffic
Google Analytics is must-have tool because it is like a compass for your business as it gives you a detailed analysis of your website’s performance.
Google Analytics not only reveal your visitors’ data, but it also gives invaluable insights on the route your marketing campaigns are taking.
Therefore, you need to ensure that all your websites are using this free tool to provide you with information about your website performance. This way, you’ll easily gather any information required to improve your website, therefore, making it give you better results.
GA is also easy to use and intuitive enough to give you access to all the features you want. Furthermore, you can conveniently choose the reports you want, be it audience reports, real-time reports, search reports, mobile performance reports, to name a few.
As you can see, Google Analytics is one resource you should never skip when setting up a website.
Tags: google, Google Analytics, tool